Originally, I struggled to discern the most appropriate way to present the presence or absence of Virginia creeper data that I had collected in my samples. However, once the data was converted to the average of Virginia creeper presence in each transect and presented in a bar graph, the findings became clear and easy to compare. Moreover, while writing my final paper, I found it difficult to present findings that were free of interpretation.
Overall, the findings supported my original hypothesis that Virginia creeper is negatively affected by anthropogenic activity. However, during my research of Virginia creeper characteristics and growth patterns, other underlying processes were brought to my attention such as if Virginia creeper had a stronger presence given a more nutrient-dense soil, in areas that facilitated more precipitation or more sunlight, or how the competition of other plants affected growth. Additionally, it would be interesting to observe the Virginia creeper over a longer period of time to better understand growth patterns in the sanded area and regrowth area. The results in these two areas could potentially differ more drastically and alter my findings if Virginia creeper was given more time to grow and disperse. Finally, it would be ideal to measure Virginia creeper growth in a controlled setting to obtain a better understanding of the impacts of anthropogenic activity on presence versus areas left undisturbed.
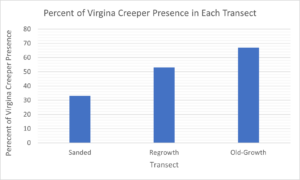
Figure 1: Graph of Virginia Creeper Presence in Each Transect
This graph illustrates the percentage of presence of Virginia creeper in the sanded, regrowth, and the old-growth areas.