Blog Post 9: Field Research Reflections

Create a final blog post that reflects on your field research. You both designed a field experiment and then carried it out. Did you have any issues with the implementation or have to make any changes to your design? Has engaging in the practice of ecology altered your appreciation for how ecological theory is developed?

My appreciation for the detail and depth in ecology has been wildly expanded. I performed the simplest of experiments and even then, the amount of hours, work, thought and literature review accompanying it surprised me. I have definitely found a new appreciation for ecologists. My implementation of design was simple from the beginning, but as I was sampling I kept thinking of more and more factors that should have been considered and further experimentation that would need to be performed to have my research make any sense or be of accuracy.

Blog Post 8: Tables and Graphs

Create a blog post discussing your table or graph. Did you have any difficulties organizing, aggregating or summarizing your data? Was the outcome as you expected? Did your data reveal anything unexpected or give you any ideas for further exploration?

My data was very simple so it was easy to put into a table. I also think that it is very easy to interpret in table form. The outcome was slightly unexpected since I was expecting to falsify my hypothesis, and ended up proving it instead. Further exploration into species richness is of course needed since my understanding and experiment are both extremely simple, but I think it was a good start to a topic not seen very frequently in the literature.

Blog post 3: Ongoing Field Observation

Initially, while studying patterns in my chosen area along a riparian zone, tress had not leafed out yet, shrubs and flowers were also not in bloom. My notes consisted of observations on biodiversity (mostly avifauna), soil type and various ecotypes along the river. I noticed that ant hills were present throughout the area, but they were not consistent within each zone. At first, my observations did not show any patterns, but then more questioning on biotic and abiotic relationships further developed my research topic.

Upon further investigation, I have decided to study the presence/absence of ants in a riparian zone where vegetation, soil type and moisture changes throughout the elevation gradient situated on the north shore of the Highwood river.  The locations which I will continue to collect data from will include the river’s flood zone, a mixed grass plane with old cottonwood trees and a section of the south facing bank towards the uplands. While each location has a distinct landscape, I will also add a fourth section near vernal wetlands, located north-east from the river just below a steep bank, to add variety in soil type, moisture and vegetation cover.

Known species:

Western Thatcher Ant (Formica obscuripes) (see photo attached)

Hypothesis and prediction

Soil type, moisture and vegetation cover influences ant habitat preference. I predict that there will be more ant occurrences along an environmental gradient in concurrence with exposed, dryer and sandier soils.

Response variable: Ant presence/absence (categorical)

Predictor variables: Soil type (categorical), Soil moisture, vegetation cover (continuous)

Caleb’s Blog Post 3: Ongoing Field Observations

The biological attribute I have chosen to study in my selected area is the distribution of tree species. My area is inbetween a bike path and a steep hill so I divided the area into 3 separate areas, the location beside the bike trail, the middle, and the location at the base of the hill.

I found that in each area, the dominant tree species was very different. The area beside the bike trail consisted of mostly evergreen trees like subalpine fir and engelmann spruce (see picture below).

In the middle area, the dominant speces was black cottonwood and aspen (see picture below).

In the area at the base of the hill, there was very little large trees and an abundant mix of small alder trees and willow plants were present (see picture below).

While walking through the gradient, I noticed that the amount of water flowing through the bases of the trees increased while getting closer to the base of the hill. I also know that evergreens prefer dry well drained soil and cottonwood and alder/willow will grow in wetter areas. Therefore, my hypothesis is that the distribution of the most abundant tree species in each area is dependant on the water content of the soil. My prediction is that the water content in the soil will be highest at the base of the hill and lowest beside the bike trail.

Based on my hypothesis, a potential response variable would be the dominant tree species of the area and one explanatory variable would be the water content of the soil. I will test this by taking soil samples throughout the gradient. This would be a natural experiment (because you cannot change the predictor variable) and this experiment would have a logistic regression design as the predictor variable is continuous (soil moisture) and the response variable is categorical (tree species). I would test the soil moisture by taking soil samples in each of the 3 areas using a distance-based sampling procedure. I would then measure the weight of the soil when wet, dry it out in the oven, then measure it when dry.


Blog Post 6: Data Collection

Thus far, I have been able to identify shorebirds (to measure shorebird diversity) at 5 sampling quadrats at each location along the human presence gradient (gradient comprises three different sampling locations) 6 times. Hence, I have collected 30 replicates for each location along the gradient. I haven’t had any problems implementing my sampling design so far, except for the fact that it requires a lot of planning in regard to timing in attempt to control for timing variations of shorebird diversity. Thus far, it seems like shorebird species richness, evenness and abundance decreases across the sampling gradient. However, I would still like to collect more replicates for each location along the gradient to see if this effect persists with more samples collected.

Post 2: Source of Scientific Information

a) For my scientific information source, I chose the following academic manuscript discussing the variations of Populous trees of riparian zones of Alberta which is a big portion of my site observations:

Floate, K. D. (2004). Extent and patterns of hybridization among the three species of Populus trees that constitute the riparian forest of southern Alberta, Canada. Canadian Journal of Botany. NRC Canada. 82:253–264. doi: 10.1139/B03-135.

b) This scientific paper is an academic peer-reviewed research manuscript. This publication indicates that the author is affiliated with a University and is an expert in his field at the Lethbridge Research Centre. His article has in-text citations, has a reference page, methods and results.

c) The Canadian journal of Botany demand that every piece of literature is refereed prior to publication.

“The Canadian Journal of Botany (Can. J. Bot.) is a refereed, primary research journal that publishes Articles, Notes, Commentaries, and Reviews, in English or French.”

Source: Instructions to Authors. (2001). Canadian Journal of Botany. National Research Council Research Press. 79(1). https://doi.org/10.1139/cjb_instruct01_e

And finally, the amount of time it took to get to publication.

“Received 6 May 2003. Published on the NRC Research Press Website at http://canjbot.nrc.ca on 15 March 2004.”

Blog 1: Observations

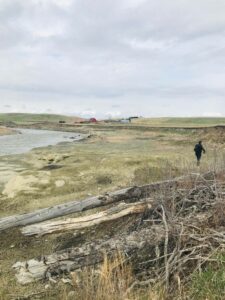
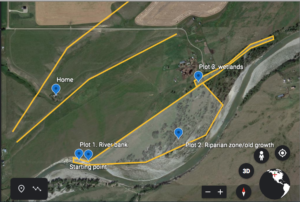
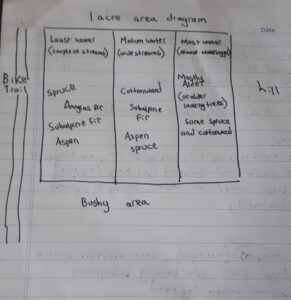
My chosen study area will consist of observing a varied riparian zone along the Highwood River, southwest of the town of High River, Alberta. This location is just 300 meters south of my house and has suffered major damages from the 2013 floods. The Highwood river originates from the collection of water from the slopes of Mount Arethusa, flowing southeast towards the Bow River. This study area is surrounded by cultivated, pasture and rangelands with pockets of native grasses. I have decided to divide approximately a 1km area into three sections due to its contrasting ecosystems.

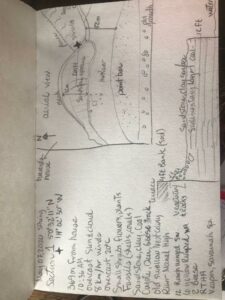
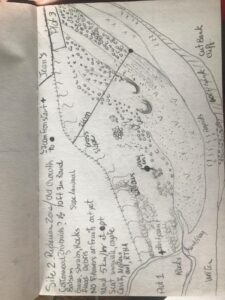
In plot 1 I am observing 80 meters of a 150 meter section of sandstone plateau caused by old erosion (pre flood) exposing various sedimentary layers where moss, shrubs, flowers and grassy vegetation is sparsely growing across the northern rocky slope just below a 4ft bank housing old swallow cavity nests.
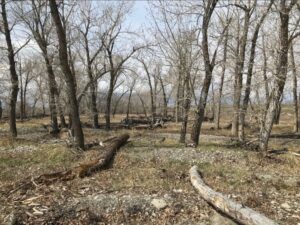
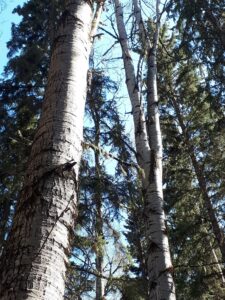
Plot 2 spans approximately 700 meters east into a old growth forest with a gentle slope till it reaches river elevation. Black cottonwood (Populus trichocarpa), Balsam poplars (Populus balsamifera) and hybrids are to be identified once the trees leaf out. Various shrubs and plant life fill the forest floor from short grasses to tall, willows and flowers. This area has massive debris piles and downed trees and river rock spread at least 200 meters from the river edge.
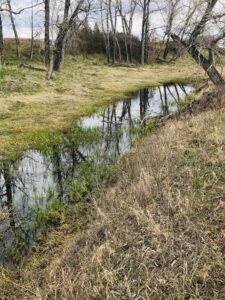
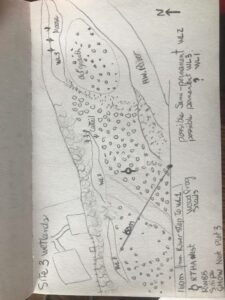
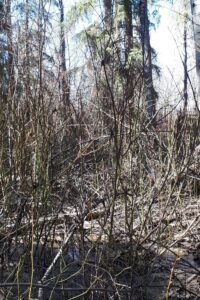
My last plot is a wetland section roughly 150 meters from the river edge spanning 500 meters east, tucked below an old cut bank of approximately 9 feet behind the house of our neighbour. These are 3 fluctuating hydroperiods which were influenced by the change in topography from the floods.

My initial observations started on May 07, 2020 at 10:30 and ended approximately at 13:00 hour on an overcast day, with winds ranging from 2-8 km/hr on average. Because of the late spring, my observations lack identification of flora mostly due to the phenological timing. However, we are in the middle of bird migration and some are already having territorial disputes, are mating and collecting nesting material. Tracks and scat were also noted (ungulates, canids, lagomorphs, rodents).

Questions:

How old on average are the trees in this riparian zone? Can I identify if cottonwood types (black or plains), balsam poplar (Populus balsamifera) or hybrids dominate the area?

Does the vegetation differ in each plot? does the pattern and communities change with environmental gradient? What are the succession stages in each plot?
What are the native species, invasive species and introduced species? Which ones are thriving? Is there a different pattern in each plot? Are soil types and recent processes big factors for community diversity and distribution?

What are the main ecosystem disturbances in each plot? Which one has greater chances of thriving despite the disturbances?

Which plot is most attractive for fauna diversity? How important are riparian zones for wildlife? Are riparian zone processes and successional events too volatile for specie site fidelity?

Blog Post 5

My initial experimental design and strategy took some significant re-thinking. After initial data gathering session in my study area, I realized I was unable to gather accurate enough data that I could then compile in a useful way. I therefore decided to switch from surveying for mule deer prints using transects, to using a plot system.

The problem with the transect system I originally planned to use was that I would have been unable to accurately monitor any individual trail created by mule deer through the snow. That is to say, keeping track of what I defined primary trails and secondary trails in my report would have been very difficult. Also, I believe transects would have provided better randomization, but made it difficult to accurately count individual deer tracks.

So, I switched from transects to five plots, four  of which had a anthropogenic snowshoe trail that ran the length or width of the plot. I surveyed for mule deer presence in the plot by counting individual tracks. I counted tracks on the established anthropogenic trail, on well used, previously created deer trails (primary trails), and on newly created trails (secondary trails).

Blog post 3

I planned on studying niche partitioning among birds as  niche partitioning theory explains that the species can co-exists in the environment in order to reduce the interspecific competition. This study focuses on the feeding habits of the different bird species and recording their behavior on the feeder. A feeder with sunflower seeds was put outside to record the observation in different niches i.e. 1) whether the birds prefer to stay at the feeder and eat their food right away, or 2) the birds come to feeder and take away the food with themselves or 3) birds look at the ground and eat the food that might have fallen off from the feeder. Location I choose is my backyard and for the replicates I am also observing the same in my friend’s backyard. Both the locations have same vegetation.

Research question- Do birds at a feeder exhibit different feeding niches?

Research Hypothesis- The birds at a feeder exhibit different feeding niches.

Prediction- If the birds exhibit different feeding niches then the individual species will be observed feeding more often in one of three niches.


Blog Post 1: Observations


My chosen study location is next to the Cougar Creek Mountain Bike Jump Park in Canmore Alberta. There is a network of footpaths which connect the surrounding communities and in this particular spot there has been an abundance of water that has accumulated around one very large tree with no other growth for about a 4 meter radius around this tree. The main tree in this location is a White Spruce (picea glauca) tree and surrounding it is a cluster of Trembling Aspens (Populus tremuloides) as well as other White Spruce and Engelmann Spruce (P. Engelmannii) trees. There were Deer and Elk tracks present in addition to various dog paw prints but as this area is a common walking trail it is difficult to know whether the present paw prints were of domesticated dogs of from the resident wolf pack as they are also found frequenting the area.


As this region is at the bottom of the Bow Valley this would be considered part of the montane region of the Rocky Mountains. This region is known for diverse wildlife and plant species as the variation of meadows and forested areas provides plenty of cover for prey species in addition to many food sources for the community. This trail network suffers from over usage from the human population in the summer so the diversity and abundance of wildflowers in the summer months can greatly vary from year to year.


  1. Will the areas with evidence of the most human usage show the least species diversity for the local flora?
  2. To what extent will wildflower populations respond to good or poor water drainage as new growth begins to sprout as we approach spring?
  3. How does the elevation of the various tree populations relate to the growth and frequency of moss growth on tree trunks.

biobookblog1pageset1

biobookblog1pageset2