I used two types of light traps to study and compare the quantity of the insects collected and assemblage composition. I compared the efficiencies of the two light trap methods among different insects, which allowed me to understand the insects’ flight activity. I compared the sampling efficiencies based on getting the main representative species or class of the local ecosystem and getting target group species. I developed a data set structure (order × sample × trap) that I will produce from the light trap research. Also, while in the field, I came up with a posteriori research problem. For instance, the few hours of rainfall in the course of the research helped me to study the effect of other different factors on the activities of the insects in the ecosystem.
The fieldwork began by proposing simple research questions and developing a hypothesis and evaluating using scientific literature. The fieldwork used different light traps to sort and identify the insects’ orders by employing simple diagnostic keys. Insects are important components of biodiversity, and therefore it is important to understand and appreciate the several roles of the insects in the ecosystem. Their interesting natural history well shows the benefits of the insects in the ecosystem. Hence facilitates the application of the insects as models of learning the ecosystem conservation.
The scientific information source for the research is Lamarre, G. P., Juin, Y., Lapied, E., Le Gall, P., & Nakamura, A. (2018). Using field-based entomological research to promote awareness about forest ecosystem conservation. Nature Conservation, 29, 39. The source is important since it addresses the main stages of the entomological research and provides general entomological knowledge and insects’ role in the ecosystem. This article is peer-reviewed as it was edited by an academic editor and was indicated to be a peer-reviewed open access journal in Nature Conservation.
Lamarre, G. P., Juin, Y., Lapied, E., Gall, P. L., & Nakamura, A. (2018). Using field-based entomological research to promote awareness about forest ecosystem conservation. Nature Conservation,29, 39-56. DOI:10.3897/natureconservation.29.26876
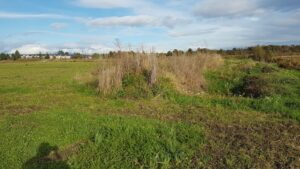
The attribute I have chosen to study is the health of perennial streams found in rangeland areas. I specifically noticed that there was disturbance to the stream bed and presence of invasive thistles in riparian zones at locations that the cattle had easy access to.
Observation:
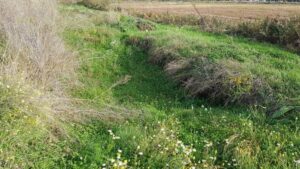
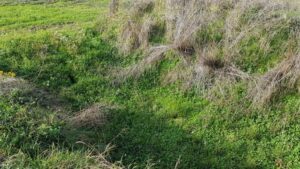
I have observed locations at three points along one perennial stream (Figure 1). The locations include an area with strong evidence of disturbance by cattle, an area upstream from the disturbance, and an area downstream from the disturbance. The locations upstream and downstream were chosen by accessibility to the locations. I have also observed two other stream locations along a perpendicular gradient that are easily accessed by cattle. I have found that the slope of the banks and access to the stream to be the biggest indicator for possible deterioration of the health of the stream. The locations that have easy access, those along the perpendicular gradient, have evidence of disturbance causing changes in the stream bed (Figure4) and the presence of Cirsium vulgare (Figure 2), and Cirsium arvense (Figure 3). These observations areimplications of decreased health of the stream. The areas along the gradient of the single stream indicate that the impact of the cattle is limited to the areas they can directly access.
Pattern:
The pattern I have observed is that there appears to be deterioration of the streams, stream beds, and riparian zones in small perennial streams in rangelands at points of low slopping access. The stream beds are highly disturbed and are no longer gravelly in appearance. In these disturbed areas the stream bed has become muddy; further, invasive thistles are present in these disturbed areas. A possible process that has caused this deterioration is cattle accessing the stream. This is particularly evident in areas of easy access due to low sloping approach to the streams.
Hypothesis:
The ability for cattle to access perennial streams in rangeland with low sloping access points is contributing to deterioration of the stream health in areas directly accessed by the cattle.
Prediction:
The stream will show diminished overall health in areas that show high disturbance and presence of invasive thistles.
Variable example:
One response variable to study would be the presence of invasive thistle, specifically Cirsium vulgare, it could be categorical and measured in presence absence. The potential explanatory variable would be that cattle are contributing to the spread of the invasive thistles shown by the presence of the thistle in areas accessed by cattle.
Below are the results from the sampling strategies:
Sampling Method
Species
Systemic
Random
Haphazard
Eastern Hemlock
Estimated- 376.0
Estimated-429.2
Estimated- 532.0
Actual-469.9
Percentage Error-20%
Percentage Error-8.5%
Percentage error- 13.2%
Sweet Birch
Estimated-136.0
estimated-116.7
Estimated-136.0
Actual-117.5
Perctage Error-15.7%
Percentage error- .68%
Percentage error- 15.7%
Yellow Birch
Estimated-100.0
Estimated-120.8
Estimated- 92.0
Actual-108.9
Percentage error-8.17%
Percentage error-10.9
Percentage error-15.5%
Chestnut Oak
Estimated-88
Estimated-79.2
Estimated-88
Actual-87.5
Percentage Error-.57%
Percentage Eroor-9.5%
Percentage error-.57%
Red Maple
Estimated-80
Estimated-100
Estimated-84
Actual-118.9
Percentage Error-32.7%
Percentage Eroor-15.9%
Percentage error-29.4%
Stripped Maple
Estimated-0
Estimated-45.8
Estimated-20
Actual-17.5
Percentage Error-100%
Percentage error- 161.7%
Percentage error-14.3%
White Pine
Estimated-0.
Estimated-4.2
Estimated-8.0
Actual 8.4
Percentage Error-100%
Percentage Error- 50%
Percentage Error-4.8
The most accurate sampling technique for the most common species, the Eastern Hemlock, was the random sampling. The error percentage is roughly half that of the other techniques used. For the rarest species, the white pine, haphazard was the most accurate. The most efficient sampling technique in terms of time was systemic which took 12 hours and 34 minutes to complete. The others were not far behind that with random taking 12 hours and 48 minutes and haphazard taking 13 hours and 8 minutes to complete. My data showed that the abundance of trees, in general, impacted the accuracy of all methods. The less dense the trees, the more likely it is to have variations in the data. Twenty four points of sampling is not enough for this location. The trees spread out in a such a way that the results can be misleading. One area may have way more of one type of tree then other locations. To get a more accurate reading more sampling is needed and spread out in a way that all types of trees can be accounted for.
The organism I am interested in is scentless chamomile (Tripleurospermum perforatum). Scentless chamomile is abundant on top, but is almost absent at the bottom of the pits.
My locations to record are:
1. On top of the mineral soil: Here the scentless chamomile is the most abundant and tall.
2. Mid-way down the slope: There is a steep decline in the abundance of scentless chamomile mid-way between the topsoil and the bottom of the pit.
3. The bottom of the pit: There is almost no scentless chamomile at the bottom of the pits.
I hypothesize that areas with abundant scentless chamomile will not be acidic. The explanatory variable would be pH (continuous) and the response variable would be scentless chamomile abundance (also continuous). I will measure the pH along the gradient to determine where it is high and where it is low and measure the abundance of the scentless chamomile to compare.
Ecology refers to the scientific research of the relations that living organisms have with respect to each other and their natural environment. Fieldwork happened in the Acadia Research Forest (ARF) situated 20 kilometres northeast of Fredericton, New Brunswick, on Highway 10. This research forest was established in 1933 and continues to function as one of Canada’s essential and oldest research forest. The Acadia Research Forest is dedicated to facilitating continuing forest research or study through secure research sites. Additionally, the forest protects wildlife habitats and species that are at risk. I visited the Acadia Research Forest on 10th September and conducted field research at night and in the daytime. The potential subject that I want to explore for my research is Insect ecology and Natural history. Based on my observations, the interesting questions that may form the subject of the research project are:
Why is it important to manage and conserve forest ecosystems?
How are insects important in terrestrial biodiversity, particularly emphasizing on their excessive abundance and species richness?
How to investigate the taxonomy and explore natural history and understand the functions or roles of the insects using observation methods in the field?
The identification of the insects and discovering their natural history as well as understanding their importance helps in creating awareness of the significance of the forest habitat conservation.
My initial data collection based on my strategy went well. Since day 1 the density of geese around the waterbodies was obvious and the areas that I chose to collect data from were fairly close to each other. As I was collecting data I noticed that the number of geese around the ponds were much higher than around the river, which was supporting my initial hypothesis. The difficulty in my sampling strategy was regarding replication, I was not sure how to do that. So, I decided to count the number of geese at the 6 locations I chose twice a day and to also record the weather to see if that affected the number of geese. I counted counted the geese 5m around the ponds and river spots because they were in groups.
I was surprised with the data because there were so many geese around the ponds which I did not expect. I collected data using this strategy for 15 days. I also thought about dividing the grassland around just one pond into 10 quadrats and count the number of geese in them but I was not sure if that would prove my hypothesis, since I wanted to compare the density around 2 kinds of waterbodies. I achieved replication by collecting data twice a day in 6 spots so I did not modify the strategy. I decided to go ahead with my initial strategy because I wanted variation and more data to prove my hypothesis.
b) It falls into the category of academic, peer-reviewed research material.
c) It contains a method and results section, references, acknowledgments, in-text citations and was written by experts in the field. The ‘scientific report’ website it was published by corroborates this and states that it only publishes peer-reviewed materials and shows the date received, accepted, and published on the article.
Batanero, G.L., León-Palmero, E., Li, L. et al. Flamingos and drought as drivers of nutrients and microbial dynamics in a saline lake. Sci Rep 7, 12173 (2017). https://doi.org/10.1038/s41598-017-12462-9
The area that I have selected to observe is the Garden City Land Teaching and Research Farm, currently leased by Kwantlen Polytechnic University (KPU) in Richmond BC. The land is primarily bog and open for citizens to walk. It also has 8 acres of farmland run by the Sustainable Agriculture Program of KPU. The specific location I chose is between the untamed bogland and the organically farmed production land. I have selected an area of large stretch of land on the southern side. This area is generally flat but has been specifically modified by the professors at KPU to do their ‘Greenhouse Gas Plot’ research project; this entailed digging down to the bog in segments and leaving other segments with the mineral soil layered top. There is a notable gradient between the two different plots. I visited October 19 at 16.00 during a cool and dry day, however the week prior saw heavy precipitation. I observed that there was a denser and more diverse group of plants closer to the peat. I observed that the scentless chamomile was very abundant on the top soil and very scarce nearer the bottom of the pits, and that clover was prominent throughout but more abundant at the bottom of the pits. overall, there was more abundance and diversity at the bottom of the pits. I am not sure whether to focus on a specific plant or where there is more diversity. Before I collect samples I will be mowing the site to simplify the observation of my sample group (TBD).
over time.
My three questions are:
Is there a correlation between the soil being disturbed and the success of new plants establishing?
Are the plants that are lower more successful due to the shade in the lower level? Or more water access?
Does the pH of the soil being closer to the peat land provide a more suitable environment for the success and diversity of plants?
This is the farmland. The pits are along the right side of the photo.
One of the pits. This picture shows the difference in scentless chamomile abundance at the top and bottom of the pit.