So far I have made two graphs:
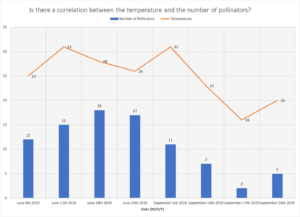
- The correlation between the number of pollinators and the temperature
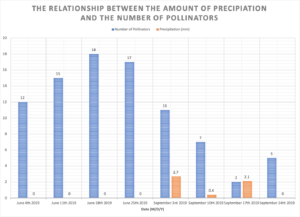
- The relationship between the number of pollinators and the amount of precipitation (mm)
I think both of these graphs are perfect for showing my data that I have collected. I think my data is all normal, obviously it would be better had I recorded data for a longer period of time.